
Church visitor retention statistics, traced to the source
39 figures on first-time guests, follow-up, attendance and church size. Each one links to the study that published it, with the year and how the data was collected.
- Last reviewed
- 39 statistics
- 19 sources from 7 publishers

Key findings about church visitors
The figures that say the most about what happens after a first visit. Each one stands on its own if you quote it.
79% of churchgoers who changed churches say the way their current church welcomed visitors positively influenced their decision to attend regularly.
71% of church switchers decided to attend regularly within three visits. Only 20% decided after the first.
21% of church switchers were contacted by a welcoming team when they visited their current church, down from 28% in 2006.
85% of Americans who have searched for a new congregation attended a worship service at one they were considering, and 69% talked with its members.
8% of people new to a U.S. congregation in the past five years had never attended one before. 69% came from another congregation.
70 people attend the median U.S. congregation in person each week, up from 65 before the pandemic. It is the first rise in 25 years of tracking.
First-time church guest statistics
How people find a church, what they weigh on a first visit, and how quickly they decide whether to stay.
14 statistics
79% say feeling welcomed mattered
Among Americans who have looked for a new congregation, 79% say feeling welcomed by clergy and lay leaders mattered, nearly as many as cited sermons (83%).
Pew Research Center recontact survey of 5,000 U.S. adults first interviewed for its 2014 Religious Landscape Study. Those who had ever searched for a congregation rated which factors played an important role.
85% attended a service first
85% of Americans who searched for a new congregation attended a worship service at one they were considering, and 69% talked with its members.
Same Pew survey. Only 37% looked online and 19% phoned, though 59% of searchers under 30 used online information.
49% have looked for a new congregation
About half of U.S. adults (49%) have looked for a new congregation, and moving house is the most common reason, cited by roughly a third of all adults.
Same Pew survey. Fewer searched after a disagreement with clergy or members (11%) or a marriage or divorce (11%).
71% decided within three visits
71% of churchgoers who switched churches decided to attend regularly within three visits; only 20% decided after a single visit.
Lifeway Research online survey of 1,001 U.S. Protestant churchgoers who attend at least twice a month and have attended more than one church as adults. Half (50%) took two or three visits.
79% say the welcome shaped their decision
79% of church switchers say the way their current church welcomed visitors positively influenced their decision to attend regularly; 49% strongly agree.
Same Lifeway survey of 1,001 Protestant churchgoers. 56% were personally welcomed by congregants and 48% by a pastor before or after the service.
31% were invited by a friend
Church switchers most often first heard of their current church through a friend’s invitation (31%), word of mouth (29%) or a family member’s invitation (27%).
Same Lifeway survey. Fewer were introduced by the church website (15%), social media (10%) or an advertisement (7%).
68% came to a worship service first
For 68% of church switchers, the first thing they attended at their current church was a worship service, down from 88% in 2006.
Same Lifeway survey, compared with a 2006 Lifeway study. Small groups, social events and streamed services were each the first contact for 6% or fewer.
69% switched; 8% had never attended
Of people new to a congregation in the past five years, 69% switched from another congregation and only 8% had never attended one before.
From the Hartford Institute’s 2024 Attender Survey, reported in its 2026 national congregations report. Another 22% were returning after a long time away from a faith community.
20% of new attendees were unchurched
Protestant pastors estimate that 20% of people new to their church in the past two years did not previously attend any church, down from 27% in 2016.
Lifeway Research phone survey of 1,003 U.S. Protestant pastors, sponsored by the Wheaton College Billy Graham Center. 12% of pastors said none of their new attendees were previously unchurched.
Lifeway Research, 2026: Pastors Report Growing Attendance, but Fewer Unchurched Newcomers
51% say a personal invitation would work
Half of unchurched Americans (51%) say a personal invitation from a friend or family member would be effective in getting them to visit a church.
Lifeway Research online survey of 2,000 Americans who had not attended a service in six months. Only 35% said they would attend a worship service if invited; a church member knocking on the door scored 21%.
44% of pastors strongly agree they are welcoming
44% of U.S. pastors strongly agree their church is a welcoming environment for newcomers, and 47% of Christians strongly agree their church is inviting to visitors.
Barna Group’s Making Space for Church Visitors briefing with Aspen Group: online surveys of 2,000 U.S. adults (Feb.–Mar. 2022) and 511 Protestant senior pastors.
Barna Group, 2024: 2 Things to Consider About Church Visitors This Easter
16% ask guests to stand
Asking guests to stand during the service is the least common welcome practice, used by 16% of U.S. Protestant churches.
Lifeway Research phone survey of 1,003 Protestant pastors. 57% of African American pastors and 24% of pastors aged 65 or older say their church does it.
Lifeway Research, 2025: Churches Aim to Welcome Guests by Different Methods
21% vs 9% of one-time visitors stay
In one church-growth study, growing churches kept about 21% of one-time visitors as regular attenders a year later; non-growing churches kept about 9%.
Charles Arn describes churches tracing every visitor from a six-week window two to three years back. No sample size or method was published; Gary McIntosh and Arn give similar rules of thumb in What Every Pastor Should Know (2013).
10,000+ mystery-guest visits
After cataloguing mystery-guest feedback from more than 10,000 worship services, Faith Perceptions listed a welcoming experience first among five impressions that decide return visits.
Faith Perceptions, a mystery-worshipper firm, shared its findings with Lifeway Research. The other four: a clear message, a personable pastor, a healthy kids ministry and authentic worship. Qualitative; no statistical method published.
Lifeway Research (Faith Perceptions data), 2018: 5 Things That Matter Most to Church Visitors
Church guest follow-up statistics
What churches do to welcome and contact guests, and how often guests say it happened to them.
5 statistics
21% were contacted by a welcoming team
Only 21% of church switchers say a welcoming team contacted them when they visited their current church, down from 28% in 2006.
Lifeway survey of 1,001 Protestant churchgoers who changed churches. 36% were asked to fill out a card by hand (62% in 2006), 12% an electronic card and 6% to text the church.
80% use printed guest cards
Most U.S. Protestant churches (80%) ask guests to fill out a printed card so they can follow up; only 38% offer an online form.
Lifeway Research phone survey of 1,003 Protestant pastors. 28% use attendance books in the pews that also collect visitor details; churches under 50 attenders are least likely to use cards (70%).
Lifeway Research, 2025: Churches Aim to Welcome Guests by Different Methods
91% have greeters at the door
Greeters at entrances (91%) and a chance to meet the pastor (91%) are the most common ways Protestant churches welcome guests; the typical church uses five or six methods.
Same Lifeway pastor survey, which asked about 11 methods; more than 99% of churches use at least one. 66% have a central information point and 41% give guests a gift.
Lifeway Research, 2025: Churches Aim to Welcome Guests by Different Methods
58% hold newcomer information sessions
58% of U.S. Protestant churches periodically host an information session for people new to the church, down from 65% in 2017.
Same Lifeway pastor survey, compared with a 2017 survey of 1,000 pastors. Central guest information points fell from 78% to 66% over the same period.
Lifeway Research, 2025: Churches Aim to Welcome Guests by Different Methods
57% stay after three visits
In the same church-growth study, visitors who came three times within six weeks stayed at 57% in growing churches and 36% in non-growing ones.
Charles Arn’s figures for two visits were 38% and 17%: retention roughly doubles once a visitor comes back a second time. No sample size or method was published.
Belonging and assimilation statistics
How many newcomers a congregation takes in, and what keeps people connected once they stay.
7 statistics
20% of attenders are new in five years
In the median U.S. congregation, 20% of attenders were new to it within the past five years, almost the same as in 2020 (19%).
Hartford Institute survey of 7,453 congregations in 79 denominations and traditions. The report finds larger congregations more effective at integrating newcomers than smaller ones.
39% strongly agree they seek new members
Only 39% of U.S. congregations strongly agree that they are actively looking for new members.
Same Hartford Institute survey. About 28% of leaders report high levels of members inviting others, though that share has risen since 2020.
44% are in a small group
On average, 44% of weekend worship attendees at U.S. Protestant churches are in a small group, Sunday school class or similar group, down from 49% in 2010.
Lifeway Research phone survey of 1,000 Protestant pastors. 39% of churches under 50 attenders say fewer than a quarter of their attendees are in a group.
25% haven’t found a church they like
One in four Americans who rarely or never attend services say a very important reason is that they haven’t found a house of worship they like.
Pew Research Center American Trends Panel survey of 4,729 U.S. adults. Among Christian non-attenders it is 28%; 14% of all non-attenders say they don’t feel welcome.
Pew Research Center, 2018: Why Americans Go (and Don’t Go) to Religious Services
73% feel a sense of community
73% of regular churchgoers say they always or often feel a sense of community with others when they attend religious services.
Same Pew survey, asked of adults who attend at least once or twice a month. 80% always or often feel a sense of God’s presence.
Pew Research Center, 2018: Why Americans Go (and Don’t Go) to Religious Services
About 1 in 5 have no community at all
About one in five U.S. adults who have never been to church, or not in at least six months, say they have no community at all.
Barna Group surveys: a February 2025 OmniPoll of 1,532 U.S. adults and a 2024 survey of 4,063 Protestant churchgoers. Among churchgoers, 57% say they engage most with pastors.
Barna Group, 2025: Fostering Relationships: A Key to Meaningful Church Engagement
41% stopped attending between churches
41% of churchgoers who switched churches stopped attending for more than three months in between, up from 28% in 2006.
Lifeway survey of 1,001 Protestant churchgoers who changed churches. 60% say a residential move led them to their current church.
Church attendance trends
How often Americans attend, how membership has changed since 1937, and where attendance has started to recover.
8 statistics
Median attendance 70, up from 65
Median in-person worship attendance at U.S. congregations rose to 70 in 2025 from 65 before the pandemic, the first gain in 25 years of tracking.
Hartford Institute survey of 7,453 congregations, set against Faith Communities Today data since 2000. The median fell to 45 in 2021 and was 137 in 2000.
31% attend weekly or nearly weekly
In 2025, 31% of Americans said they attend religious services weekly or nearly weekly, while 57% said they seldom or never attend.
Gallup telephone interviews with 13,454 U.S. adults across 2025. Majorities have said they rarely or never attend every year since 2018.
Gallup, 2026: Americans’ Religious Engagement Holds at Lower Levels
33% attend in person monthly
One-third of U.S. adults attend religious services in person at least monthly, and 40% take part monthly either in person or online.
Pew Research Center 2023–24 Religious Landscape Study of 36,908 U.S. adults. 25% attend in person weekly; 37% say they are members of a house of worship.
47% belonged to a congregation in 2020
In 2020, 47% of U.S. adults belonged to a church, synagogue or mosque, the first time below half in Gallup’s eight-decade trend.
Gallup three-year aggregates of more than 6,000 U.S. adults each. Membership was 73% when first measured in 1937 and 70% in 1999.
Gallup, 2021: U.S. Church Membership Falls Below Majority for First Time
1.6 weekends a month
The average churched U.S. adult attends church 1.6 times a month, roughly two of every five weekends.
Barna Group tracking data from 132,030 adults over 25 years ending July 2025. Gen Z churchgoers now average 1.9 weekends a month and Millennials 1.8, the highest in Barna’s tracking.
Barna Group, 2025: New Barna Data: Young Adults Lead a Resurgence in Church Attendance
54% of pastors report growth
54% of U.S. Protestant pastors say average worship attendance grew at least 4% between fall 2023 and fall 2025; 16% report a decline.
Lifeway Research phone survey of 1,003 Protestant pastors. Churches of 250 or more were the most likely to be growing (70%).
Lifeway Research, 2026: Pastors Report Growing Attendance, but Fewer Unchurched Newcomers
66% dropped out for at least a year
66% of young adults who attended a Protestant church regularly as teenagers dropped out for at least a year between ages 18 and 22.
Lifeway Research online survey of 2,002 adults aged 23–30 who attended regularly in high school. 29% of dropouts said they no longer felt connected to people in their church.
Lifeway Research, 2019: Most Teenagers Drop Out of Church When They Become Young Adults
4,000 closed; 3,800 started
An estimated 4,000 U.S. Protestant churches closed in 2024, while 3,800 new ones were started.
Lifeway Research estimate from 35 denominational groups representing 58% of Protestant churches. In 2019, closures outpaced openings 4,500 to 3,000.
Lifeway Research, 2026: Church Closures Eclipse Openings in the U.S.
Church size statistics
Most U.S. congregations are small, yet most churchgoers worship in large ones.
3 statistics
Nearly 70% have 100 or fewer
Nearly 70% of U.S. congregations have 100 or fewer people at a typical weekly service, and 40% have 50 or fewer.
Hartford Institute survey of 7,453 congregations across 79 denominations and faith traditions. About 20% have 101–250 attenders and 13% more than 250.
Median 70; the average attendee’s church has 360
The median U.S. congregation has 70 regular participants, but the average churchgoer worships in a congregation of 360.
From the 2018–19 National Congregations Study, as reported by its director in Clergy in America. The largest 9% of congregations contain about half of all churchgoers.
Church volunteer statistics
How many people serve regularly, and how that changes with the size of the church.
2 statistics
40% volunteer regularly
Congregational leaders estimate 40% of their participants volunteer regularly, back to pre-pandemic levels after falling to 15% during COVID-19.
Hartford Institute survey of 7,453 congregations. Smaller congregations report 48% volunteering and the largest 30%.
42% of adults volunteer regularly
On average, 42% of adults in U.S. Protestant churches volunteer regularly, but 18% of pastors say fewer than one in five of their adults do.
Lifeway Research phone survey of 1,000 Protestant pastors. The share of pastors reporting under 20% volunteering rose from 13% in 2008.
Myths that don’t hold up
These figures appear in sermons, conference talks and church-growth blogs. We traced each one as far as we could and recorded what we found, so you can decide how much weight it deserves.
“Roughly 80% of first-time guests never return”
We couldn’t trace a sourceUsually credited to: Lifeway Research, or simply “research”. Vendor blogs give ranges up to 90% without naming a study.
No Lifeway Research release, report or fact page we could find states a first-time guest return rate. Lifeway’s guest studies (pastor surveys in 2017 and 2024, church switchers in 2023) measure what churches do and how switchers decided, not how many visitors come back. The closest traceable figures are practitioner numbers that measure something different: Charles Arn reports growing churches kept about 21% of one-time visitors as regular attenders a year later and non-growing churches about 9%, with no published sample; Herb Miller (How to Build a Magnetic Church, 1987, as quoted by David Durey) wrote that only 12% of first-time visitors in the average congregation return and eventually join. Both describe not becoming a regular attender, which is not the same as never coming back.
Sources we checked
- Lifeway Research: Churches Aim to Welcome Guests by Different Methods (2025)
- Lifeway Research: Church Switchers Identify Factors Behind Their Decision (2023)
- Charles Arn: Visitors & Guest Retention Strategies (2015 repost)
- David Durey: Assimilating New People Into the Church (quotes Herb Miller)
- Text In Church: why first-time guests don’t return (cites no study for its range)
“Guests decide whether they will come back within the first 10 minutes”
Consultant rule of thumb, no published methodUsually credited to: Church consultants; sometimes credited to Barna Group.
The most widely shared written version is Rick Ezell’s “Five Must-Know Facts about First-Time Guests” (Lewis Center for Church Leadership, 2012), which states it as fact number one from his own experience visiting churches. Nelson Searcy’s Fusion (2007) uses a seven-minute “street to the seat” window, and Gary McIntosh is quoted as saying guests form an opinion “within minutes or even seconds”. None reports a measurement, and we found no Barna publication that states it. The research that exists points the other way: only 20% of church switchers in Lifeway’s 2023 study decided after one visit, and Pew found sermons (83%) weigh as heavily as the welcome (79%).
Sources we checked
- Rick Ezell: Five Must-Know Facts about First-Time Guests (2012)
- Stephen Rice: summary of the seven-minute window in Searcy’s Fusion (2013)
- David Durey: Assimilating New People Into the Church (quotes McIntosh)
- Lifeway Research: Church Switchers Identify Factors Behind Their Decision (2023)
- Pew Research Center: The search for a new congregation (2016)
“Guests contacted within 36 hours are far more likely to return: 85% within 36 hours, 60% within 72 hours, 15% after a week”
Consultant rule of thumb, no published methodUsually credited to: Herb Miller, church-growth consultant.
The figures trace to Herb Miller’s How to Build a Magnetic Church (Abingdon Press, 1987), pages 72–73 as cited by David Durey: when laypeople make 15-minute home visits to first-time visitors within 36 hours, 85% return the following week; within 72 hours, 60%; a week later, 15%; and if the pastor visits instead, each figure is cut in half. Miller published no sample, method or date range, and the finding concerns unannounced lay home visits in the 1980s, not texts, emails or calls. We could not open the book itself (the Internet Archive copy is lending-restricted); the wording and page numbers come from Durey’s citation. Sites such as EvangelismCoach.org repeat the percentages without those conditions.
Sources we checked
“Follow up within 48 hours or the guest is unlikely to return”
We couldn’t trace a sourceUsually credited to: “Some research” or “several studies”, unnamed.
We found it stated with no citation, for example by the Georgia Baptist Mission Board (2021: “Some research indicates that retention is best if church follow up happens within 48 hours”) and EvangelismCoach.org. No study measuring a 48-hour threshold turned up. It appears to be a loosened version of Miller’s 36-hour figure. Prompt, personal follow-up is sensible practice; the specific deadline is not a research finding.
Sources we checked
What this means for your follow-up
Six practical conclusions, each drawn only from the statistics above.
Plan for the second and third visit
Half of church switchers took two or three visits to decide, and only 20% decided after one (Lifeway Research, 2023). In Charles Arn’s study, the share of visitors who stayed roughly doubled once they came back a second time (Charles Arn, 2015, consultant figure). Treat a first visit as the start of a short sequence.
Make the welcome personal
79% of switchers say the welcome shaped their decision to stay, and 56% were greeted personally by members before or after the service (Lifeway Research, 2023). Feeling welcomed by clergy and lay leaders mattered to 79% of Americans choosing a congregation (Pew Research Center, 2016).
Contact every guest after the visit
Only 21% of switchers were contacted by a welcoming team, down from 28% in 2006 (Lifeway Research, 2023). We found no study that sets a deadline in hours, so make the contact prompt and make it personal.
Ask for contact details in more than one way
80% of Protestant churches use a printed guest card and 38% offer an online form (Lifeway Research, 2025). Among switchers, the share asked to fill out a card by hand fell from 62% in 2006 to 36% (Lifeway Research, 2023). A guest who never leaves details can’t be followed up.
Expect newcomers to be comparing churches
69% of people new to a congregation came from another one (Hartford Institute for Religion Research, 2026), and 60% of switchers say a move led them to their current church (Lifeway Research, 2023). Many of your guests are measuring your welcome against the church they left.
Equip members to invite
Switchers most often first heard of their current church through a friend’s invitation (31%) or a family member’s (27%) (Lifeway Research, 2023). Half of unchurched Americans say a personal invitation would get them to visit (Lifeway Research, 2016).
Give every guest a person who follows up
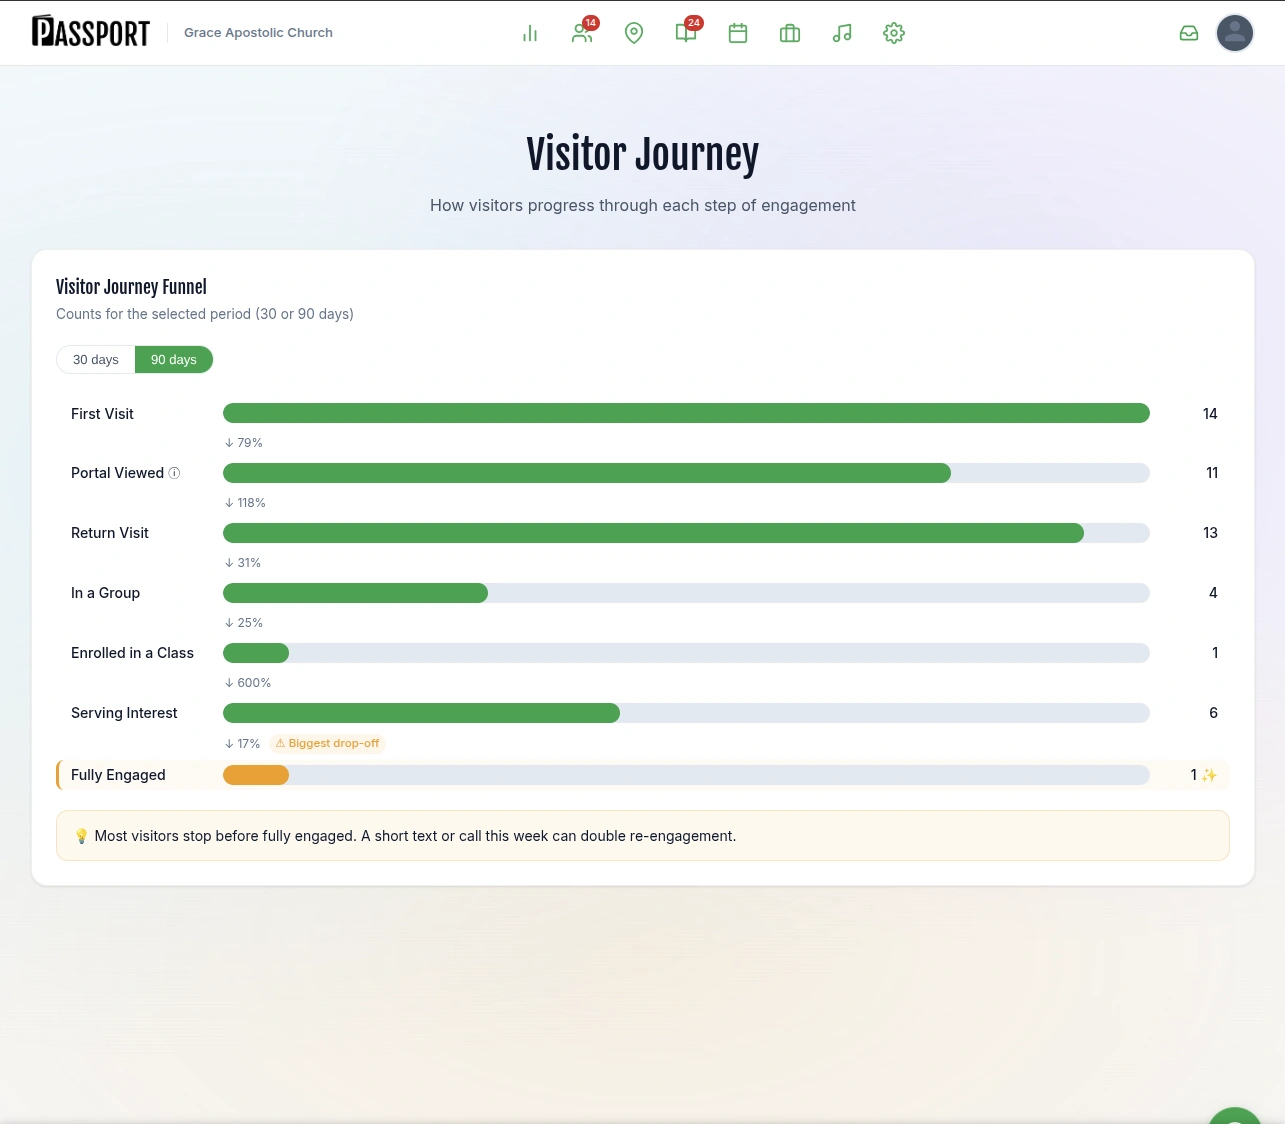
Passport records each first-time guest from your connection card, QR welcome card or Plan Your Visit page, assigns a named person to follow up, and sends the first text automatically. It runs alongside Breeze or Planning Center, and its reports show which guests came back.
- 30-day free trial, no charge today
- Cancel a monthly plan anytime
- Most churches are live in under 30 minutes
How we compiled this
We started with primary sources: Lifeway Research, Pew Research Center, Gallup, Barna Group, the Hartford Institute for Religion Research and the National Congregations Study. For each figure we opened the page that publishes it and checked the number, the wording, the year and how the data was collected. A figure that appeared only in blog posts, or in a book we could not open, was left out or listed under myths with what we found.
Every statistic carries one of three labels.
- Research is a representative, repeated measurement with a published method, such as Gallup’s trend series, Pew’s Religious Landscape Study or the Hartford Institute’s congregational surveys.
- Survey is a single poll with a published sample and margin of error.
- Consultant figure is a number from a church consultant who published no sample or method. A few are included because they are widely quoted, and the label sits next to each one.
Figures are reported as each source states them, for its own population: U.S. adults, Protestant pastors, or Protestant churchgoers who changed churches. We don’t combine or adjust them. The page was last reviewed on October 17, 2026, and we update it when the major studies publish new data.
Questions about church visitor statistics
No national study measures first-time guest return rates. In a consultant study by Charles Arn (2015), growing churches kept about 21% of one-time visitors as regular attenders a year later and non-growing churches about 9%, with no published sample. The share of guests said not to come back, usually quoted as 80%, could not be traced to any published study.
The median U.S. congregation had 70 people at in-person worship each week in 2025, according to the Hartford Institute for Religion Research's survey of 7,453 congregations. Because large churches hold most attenders, the average churchgoer worships in a congregation of about 360 regular participants (National Congregations Study, 2018–19).
Most decide over a few visits. In Lifeway Research's 2023 study of churchgoers who changed churches, 71% decided to attend regularly within three visits and 20% after one, and 79% said the way the church welcomed visitors positively influenced their decision. Pew Research Center found 83% of people choosing a congregation weigh the quality of sermons and 79% weigh feeling welcomed by leaders.
No published study sets a deadline. The often-quoted 36-hour figure comes from Herb Miller’s 1987 book about in-person home visits and includes no sample or method, and we found no source for the 48-hour version. The research does show personal contact is uncommon: only 21% of church switchers in a 2023 Lifeway Research study were contacted by a welcoming team.
In 2025, 31% of Americans told Gallup they attend religious services weekly or nearly weekly, and 57% said they seldom or never attend. Pew Research Center's 2023–24 Religious Landscape Study found 25% attend in person weekly and 33% at least monthly.

Turn these numbers into a follow-up routine
Passport gives every first-time guest a named person to follow up and keeps the next steps on schedule. Try it free for 30 days alongside the system you already use.
- 30-day free trial, no charge today
- Cancel a monthly plan anytime
- Most churches are live in under 30 minutes